Pascalwb May 26, 2016
Intro to Photography Class
Better known as Reddit Photoclass
06 – The Histogram
As we saw in the last lesson, exposure is one of the most important controls of the final image. We have discussed how to modify exposure, but not how to review it. This is the role of a very powerful tool: the histogram.
 As a rule of thumb, the LCD screen should never be trusted to evaluate exposure. It is not designed to produce an accurate rendition of the image and how bright your photo appears will depend on a variety of factors, including the ambiant light levels and the brightness setting you applied to the screen. For this reason, you might have the bad surprise of thinking your image is well exposed in the field, only to find out the screen misled you when you get back to your computer.
A histogram, on the other hand, is a more “scientific” way of evaluating exposure, and it will always be available and identical on all devices, whether the LCD screen of your camera or your fancy calibrated computer monitor. All digital cameras offer post-capture histograms – often in one of the “image details” modes (check your manual), and some models also have “live histogram”, a very useful feature showing what the histogram would be if you took the photo at that instant. Since a live histogram is not possible to draw on an optical viewfinder, this is a feature rarely found on DSLRs, however.
Enough introduction, let’s talk about what a histogram really is. Let’s consider a black and white jpg file. It is coded in 8 bits, which means that each pixel, each dot in the image, can have any of 2**8 (2 to the power of 8) = 256 values, all different levels of gray. 0 is pure black, 1 is slightly brighter, etc until you reach 255, pure white. Now let’s imagine we have a bunch of marbles and a neat series of 256 vertical tubes, neatly arranged in a line. We will go through the image pixel by pixel and look at the brightness of each one. Let’s say the first one is pretty dark, around 15: we put a marble inside tube number 15. The next one is a bit brighter, a 20, so we put a marble inside tube 20. The next pixel is also a 20, we put a new marble and now have a higher stack of marbles in tube 20. We do this for a couple of million pixels until we have looked at every individual pixels, then we take a step back and look at our line of tubes.
If the image was very dark, we will have many marbles in the tubes on the left, between 0 and 50, say, and not so many on the right, bright side. Conversely, if the image was overexposed, the tubes will be very full on the right side and almost empty on the left. And if we have a nice exposure, then all the marbles will be roughly in the middle.
This is exactly how a histogram is created. Of course, counting millions of pixels and remembering the levels of each tube would take us a good while, but this is the kind of things computers are very good at, and it is virtually instantaneous.
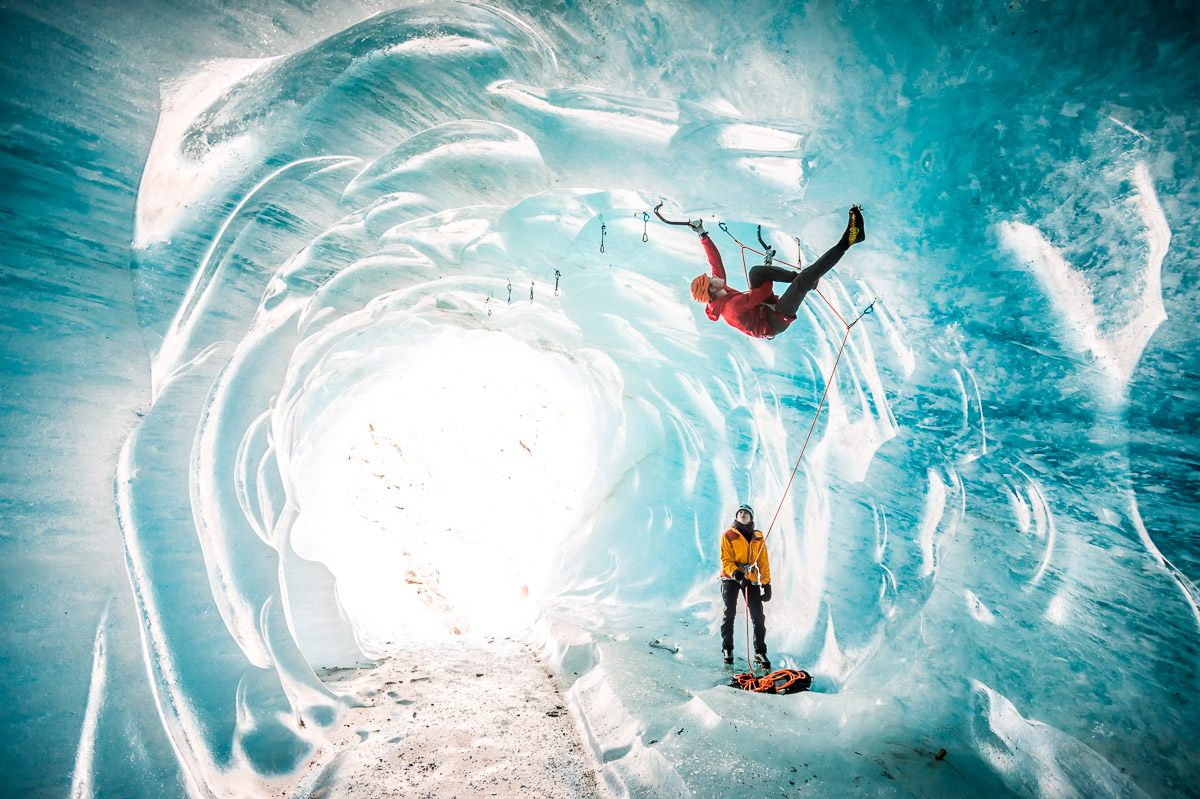
Here are some concrete examples. You can have one very dark image:

and its associated histogram:

Notice how all the data is shifted far to the left, with almost nothing on the middle and the right side. Also notice that the headlamp beams are too small to be noticeable in the histogram.
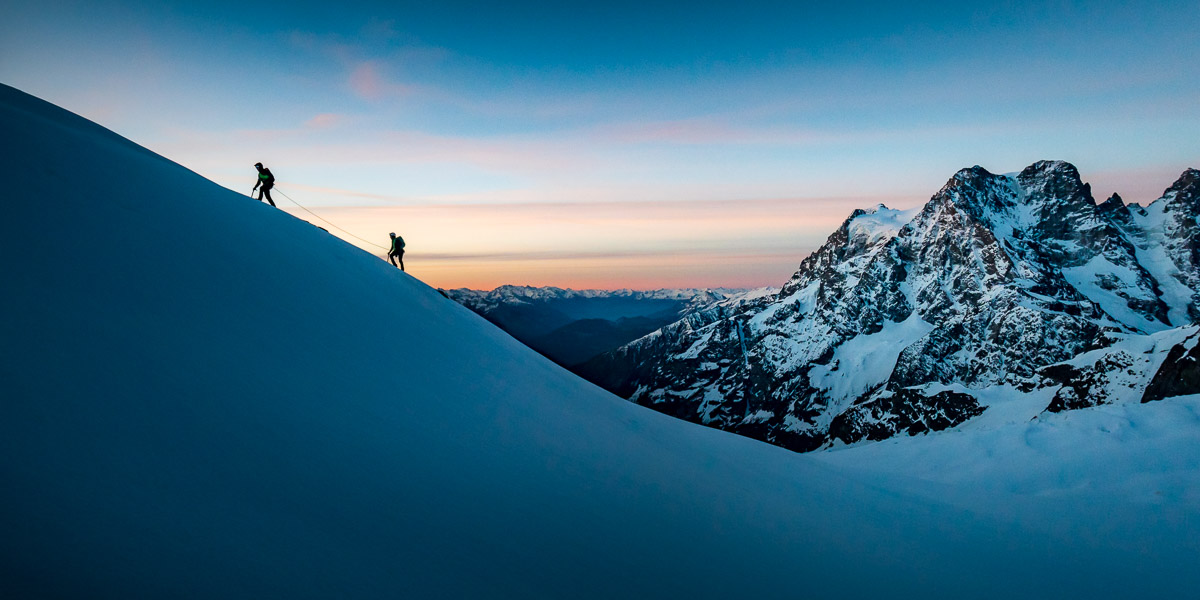
Conversely, you can have a fairly bright image:

with large areas close to white. Its histogram:

is shifted to the right, and there is a small bar to the right edge, which means we have lost some details to pure white. In this case, it is ok since this corresponds to a smooth snow surface. This is a good example of when a “bad” exposure can also be correct.
Finally, a more common image:

and its histogram:

showing a nice distribution from pure black to pure white, with nothing too extreme.
There are several important things to notice. First, unless you have been playing with the image in photoshop, there won’t be sharp transitions from 0 to a suddenly high value. Laws of distributions ensure that we always obtain some form of bell curve.
The histograms makes it very easy to visualize how you control exposure: all you are doing is shifting the entire histogram to the right (if you overexpose) or to the left (if you underexpose). And if you push it too far and hit the edges, something interesting happens: the histogram “crashes” and puts all the marbles in the last line, next to the edge: pure white, or pure black. This means that the information is lost forever, and this is something you will usually want to avoid at all costs.
An ideal histogram, then, is relatively easy to define: it is a bell curve covering the whole width and finishing exactly at the edges, with no lost details. This also happens to be what the exposure meter in your camera will try to produce.
There are several more advanced points which can be discussed:
- So far, we only talked about brightness, not about colours. Colour information is coded in three channels (Red, Green and Blue, also known as RGB) and some cameras show individual histograms for each channel. This is useful information in one situation: when you have a very brightly coloured object, it is possible to blow out the corresponding channel (go so far to the right that information is lost) without it showing in the main histogram. It is otherwise safe to ignore these specialized histograms.
- For RAW shooters (which we will cover in a while), you should be aware that the displayed histogram is the one from the jpg preview file, not the one from your actual RAW data. This means that you can sometimes recover more information than you think. This is something camera makers could fix relatively easily but refuse to do, for some reason.
- Due to the way information is stored in digital cameras, there are more details in highlights than in shadows. If you plan on using significant post-processing, you should try to shift your histogram to the right as far as you can without getting pure white, then shift it back left in post-processing. This is known as the “expose to the right” technique, and it does produce marginally better images.
 Assignment
Today’s assignment will be relatively short. The idea is simply to make you more familiar with the histogram and to establish a correspondence between the histogram and the image itself.
Choose a static scene. Take a picture and look at the histogram. Now use exposure compensation in both directions, taking several photos at different settings, and observe how the histogram changes. Does its shape change? Go all the way to one edge and observe how the data “slumps” against the edge. Try to identify which part of the image this corresponds to.
Next, browse the internet and find some images you like. Download them (make sure you have the right to do so) and open them in a program which allows you to see the histogram, for instance picasa or gimp. Try to guess just by looking at the image what the histogram will look like. Now do the opposite: try to identify which part of the histogram corresponds to which part of the image.
19 Comments
-
-
fuck you
-
nigbob
-
daddy shut up
-
-
fuck you
-
-
-
Thank you for this series, a lot of new things to learn about histogram.
-
Thank you for these great lessons! I never knew my camera had a histogram built in. Since I’m doing the lessons in quick succession, I still had the pictures from the aperture, shutter, and ISO lesson on the card. Looking at the histogram for shots that I knew were under or over exposed really helped me understand this great tool (that I never knew I had.)
Thank you again.
-
I read somewhere else that you get more details in shadows that you can enhance post processing then highlights, which is exactly the opposite of what you stated at the end of your post. It seems to work this way for my personal processing with a pretty decent point and shoot when I’m hiking extensive miles and don’t feel like lugging out my DSLR.
It could just be a perception thing. I’m going to have to tinker with my camera now to see which one is better.
-
jgftjutfcghxdrujtrcdjutrd
-
I’m the best barber in Brewster, you come in to my shop and when you come out ill make sure you never get girls
-
What’s the easiest way to see histogram data on pictures from the web? I thought Flickr’s EXIF data would shot it, but it doesn’t seem to. Great series, by the way!
-
I started photography 3 years ago and know quite a lot information, but started these lessons and have learned sooo much more. the histogram was one thing i never understood until this great lesson! Im getting to use Adobe Lightroom and it has a live histogram on it. So i was able to adjust the exposure and see how it affects.
-
похвальный вебсайт https://www.7milliondollars.com
-
hydraruzxpnew4af – гидра онион зеркала, гидра онион зеркала
-
Скачать NiceHash Miner Legacy – XMRig 5.3.0, Скачать XMRig
-
check out this site https://royal-casino.online
-
Used the pictures from last assignment and saw that the histogram was heavily leaning to the left (dark). The only pictures that seemed to have a “good” histogram (but were bad pictures) were the purposefully overexposed ones. The subject of the picture was a naturally dark object with a black background, so this would be expected.
Saved some images from the ‘net and opened them with GIMP to check histograms with “Windows -> Dockable Dialogs -> Histogram”. Results were similar to expectations. Visually “appealing”/balanced images tended to have a balanced histogram.
I also noticed that my camera has a feature for “peaking color” which I initially thought was highlighting areas that were losing detail due to being too light/dark (outside histogram range). Turns out it’s just outlining the “in focus” range.
-
qfh3eb
-
vjxxdx
Awesome series. Great easy analogy to understand histogram. Thanks.